Top UK Locations to Buy a House with Significant Growth Potential

The latest housing market data from England and Wales reveals a fascinating story of contrasting fortunes across different regions, highlighting the complex and often divergent nature of Britain’s property market. Our analysis with BLG Development Finance of median house prices between March 2023 and March 2024 uncovers significant variations in market performance, with some areas experiencing remarkable growth while others face substantial declines.

Top 10 neighbourhoods with the highest increase in property prices
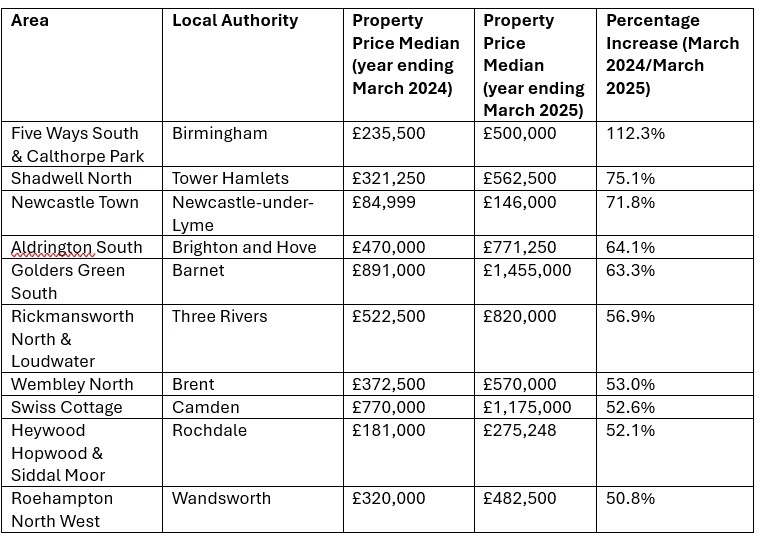
Area Local Authority Property Prices (March 2023) Property Prices (March 2024) Percentage Increase (March 2023/March 2024)
Norwood Green South Ealing £410,000 £760,000 85.4%
Camberley Town Surrey Heath £347,750 £611,250 75.8%
Parsons Green East & Eel Brook Common Hammersmith and Fulham £1,020,500 £1,680,000 64.6%
Woodcote Croydon £528,750 £857,500 62.2%
Central Solihull & Sharmans Cross Solihull £317,500 £490,000 54.3%
Highgate West Camden £707,000 £1,085,000 53.5%
De Beauvoir Hackney £650,000 £985,000 51.5%
Wimbledon Park & Durnsford Road Merton £612,500 £918,000 49.9%
Herne Hill & Dulwich Park Southwark £1,110,000 £1,650,000 48.6%
Chiswick South West Hounslow £585,000 £865,000 47.9%


Top 10 neighbourhoods with the highest increase in property prices (outside of London)

Area Local Authority Property Prices (March 2023) Property Prices (March 2024) Percentage Increase (March 2023/March 2024)
Camberley Town Surrey Heath £347,750 £611,250 75.8%
Central Solihull & Sharmans Cross Solihull £317,500 £490,000 54.3%
Hamilton North Leicester £148,000 £215,000 45.3%
Harraton, Rickleton & Fatfield Sunderland £164,000 £235,000 43.3%
Towednack, Lelant & Carbis Bay Cornwall £310,000 £440,000 41.9%
Devonshire Quarter Sheffield £122,750 £171,250 39.5%
Farnley West & Gamble Hill Leeds £186,000 £256,250 37.8%
Central Slough & Upton Court Slough £308,500 £425,000 37.8%
Bournville West Birmingham £285,000 £391,500 37.4%
Dorking South Mole Valley £460,000 £628,000 36.5%


Top 10 neighbourhoods with the highest decrease in property prices
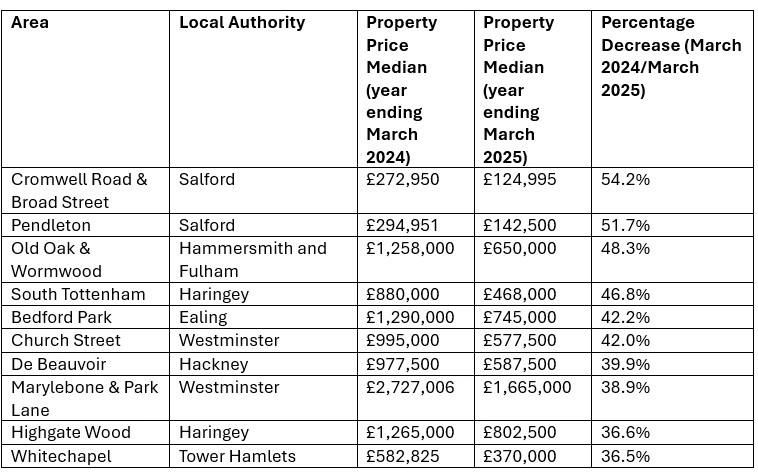
Area Local Authority Property Prices (March 2023) Property Prices (March 2024) Percentage Decrease (March 2023/March 2024)
St John’s Wood South Westminster £1,234,325 £615,000 50.2%
St George in the East & Wapping North Tower Hamlets £1,126,000 £566,250 49.7%
Holland Park Kensington and Chelsea £1,897,500 £1,057,500 44.3%
Chopwell & High Spen Gateshead £159,495 £93,000 41.7%
Broughton East Salford £232,000 £144,000 37.9%
Lozells West Birmingham £240,000 £152,500 36.5%
Isles of Scilly Isles of Scilly £550,000 £350,000 36.4%
Wellington East Telford and Wrekin £236,000 £151,500 35.8%
Manningham & Lister Park Bradford £170,000 £110,000 35.3%
Knowsley Village & Southdene Knowsley £205,995 £135,000 34.5%


Methodology:


Conclusion:

These current patterns suggest a market that is realigning rather than fundamentally weakening, with clear opportunities in specific areas despite broader challenges.

The migration of value to suburban locations, particularly in London’s outer regions, might represent a lasting shift in the market’s structure. However, the significant price corrections in some prime central areas could also present opportunities for buyers who have been previously priced out of these markets.

This analysis emphasises the importance of detailed local market knowledge and suggests that while the overall market might be cooling, opportunities for both buyers and sellers continue to exist in specific locations. The key is understanding where these opportunities lie and what factors are driving local market performance.

Want to talk to us?

 If you have enjoyed reading this post and want to get in touch, please complete the form below and a member of the team will be in-touch shortly.